Think you know everything about your family tree? Well, think again, because MyHeritage has introduced a fascinating feature that reveals the answers to questions about your tree you never even knew you had – Family Statistics.
What is Family Statistics? Your tree, by the numbers
Your work as a family historian is to uncover as many facts as possible about your ancestors. These facts — dates, places, and other details — help to tell the story about these individuals and the larger family as a whole. But what about your tree itself? What sort of stories can it tell?
As it turns out, there’s a lot of interesting information to glean from your family tree. Whether it contains 50 people or 5,000 people, you can learn a lot from your tree’s statistics by exploring its analytics, analyzing its data, and exploring its trends. MyHeritage has found a way to present these stats that’s visually lovely, easy to read, and full of insights.
You can also use this information to improve your family tree. Most of the data presented in MyHeritage Family Statistics invites you to dig deeper, letting you dive directly into your MyHeritage family tree to update details and improve, correct, or refine your ancestors’ profiles. As you work through the analytics, you’ll learn not only about the folks from whom you descend, but also ways to become a better, more thoughtful, and more focused genealogist. Read on, and we’ll show you how.
Make Instant Discoveries in Your Family Tree Now
Imagine adding your family tree to a simple website and getting hundreds of new family history discoveries instantly. MyHeritage is offering 2 free weeks of access to their extensive collection of 39 billion historical records, as well as their matching technology that instantly connects you with new information about your ancestors. Sign up using the link below to find out what you can uncover about your family.
Please note that we sometimes work with MyHeritage and other genealogy companies to bring you information about their new features. We may receive a fee if you make purchases via some links in this article. This helps us keep Family History Daily’s content free for all.
Finding Family Statistics on the MyHeritage site
Family Statistics is an exclusive feature included at no additional cost for all MyHeritage users. To find your tree’s personalized Family Statistics page, navigate to the Home dropdown on the main page of your MyHeritage family website.
If you haven’t yet uploaded your tree to MyHeritage (and have a tree under 250 people) you can sign up at no cost for limited access (scroll to the bottom of the page for the free sign up link). If you have a tree larger than 250 or would like to take advantage of their expansive record collections, instant discoveries and unique tools you can use a two week free trial here.
Note that if you manage more than one tree site on MyHeritage, you will have the option to aggregate or combine statistics from all of the trees in the Family Statistics results. For our purposes, we’re showing results from one tree only.
What Family Statistics includes
The sleek new and improved presentation of Family Statistics includes dozens of stats covering the following topics:
39 Billion Genealogy Records Are Free for 2 Weeks
Get two full weeks of free access to more than 39 billion genealogy records right now. You’ll also gain access to the MyHeritage discoveries tool that locates information about your ancestors automatically when you upload or create a tree. Find your ancestors now.
Each of these sections contains several graphics representing various information gathered from your tree.
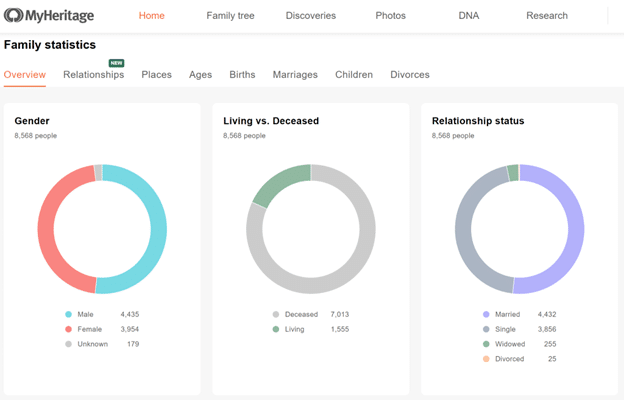
The first time you access your tree’s Family Statistics option, it may take a moment for MyHeritage to load and display your results, especially if you have a large tree. Soon, though, you’ll see the Overview screen, which presents visual representations of the genders of the people in your tree, the number of living and deceased, and their relationship status.
Pretty interesting stuff, right? It’s pretty cool to know, for example, that I have significantly more males than females in my tree, and that the number of single folks is almost as high as the number of married people. But how does this information help you improve your tree?
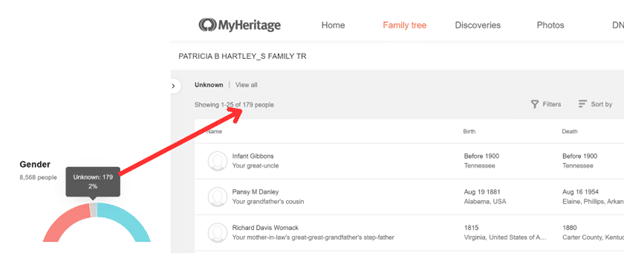
You’d probably agree that most of the individuals in your tree has a gender. Unfortunately, the Gender section of my tree’s overview shows that I have not noted the gender of 179 people. That’s a fact that should be reflected in each profile, so I need to fix it. Thankfully, MyHeritage offers an easy way to do that.
Quick fixes
When I click the line under the graph that shows 179 Unknown genders, MyHeritage takes me to a listing of those people. I can easily click each and update their gender information one by one.
You can use the information in the other two graphs in a similar way. For example, clicking on the Living portion of the Living vs. Deceased graph shows all the individuals in my tree whose profiles are missing death dates or are not marked as deceased.
While it may be true that some of the people in the list produced by MyHeritage are indeed alive, I don’t believe that 1,555 of the 8,000+ in my tree are still living. Using the “Sort by” tool at the top of the list, I can sort it by the earliest birth date, which in my case revealed folks all the way back to the 1500s who are showing up in my tree as Living. Again, I can use the list to fix these errors one at a time.
What’s in a name?
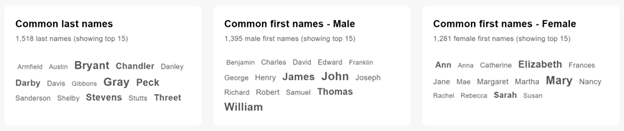
The Family Statistics Overview page has even more to offer! Scroll down further and you’ll see three word clouds full of names. Each shows the 15 most common names that appear in your tree: Last names, male first names, and female first names. The more common the name, the larger it appears in the graphic.
When you hover over a particular name, MyHeritage will show you exactly how many people in your tree have that moniker. I found it interesting that James, the third most common male first name in my tree with 348 entries, is the name I chose for my son — and at the time I had no idea how many of his ancestors shared his name.
All about your ancestors’ relationships
Although much of the information presented in MyHeritage Family Statistics was previously available to users (in a much less attractive and user-friendly format), the Relationship data is brand new. This page offers six charts to expand your knowledge of how you’re related:
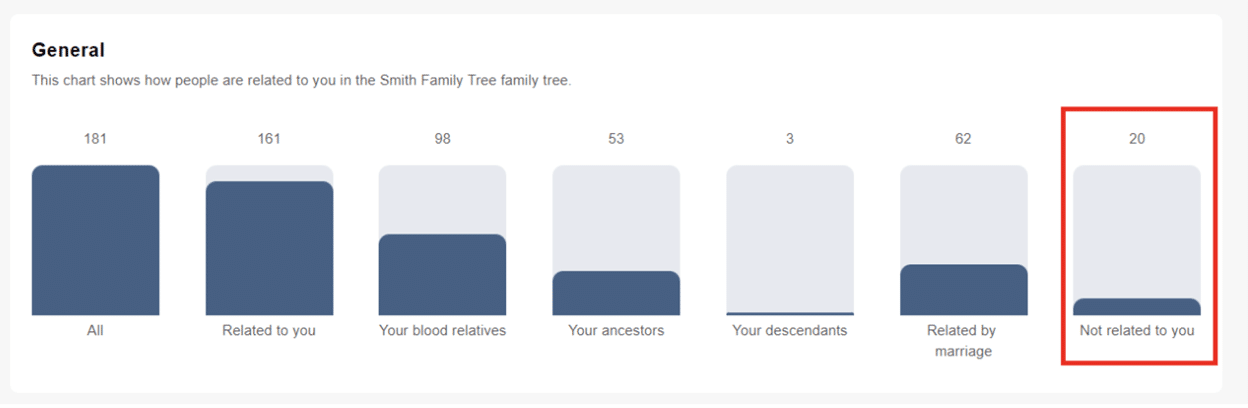
General breaks down exactly how people are related to you (blood relatives, related by marriage or adoption, descendants, ancestors, etc.).
Steps away from you shows the number of people in your tree who are one step, two steps, three steps, etc. away from you.
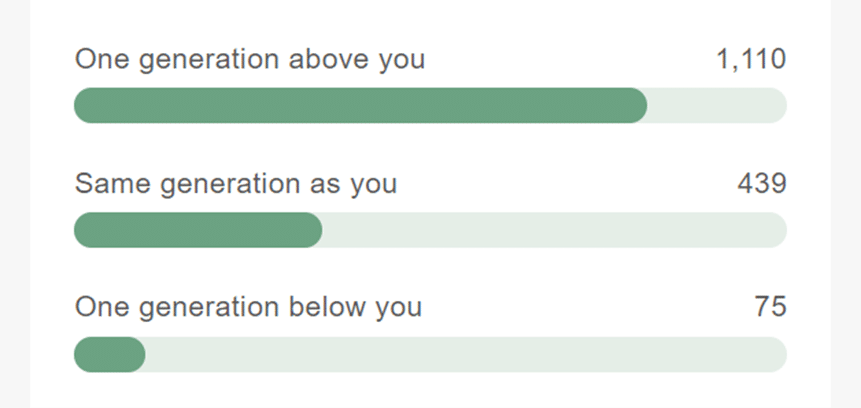
Generation difference from you shows the people in your family tree according to the number of generations apart they are from you.
Marriages away from you shows how people are related to you without marriage (your blood relatives), by one marriage, by two marriages, and by three marriages.
How people are related to you through the members of your immediate family (through your father, mother, siblings, spouse, etc.)
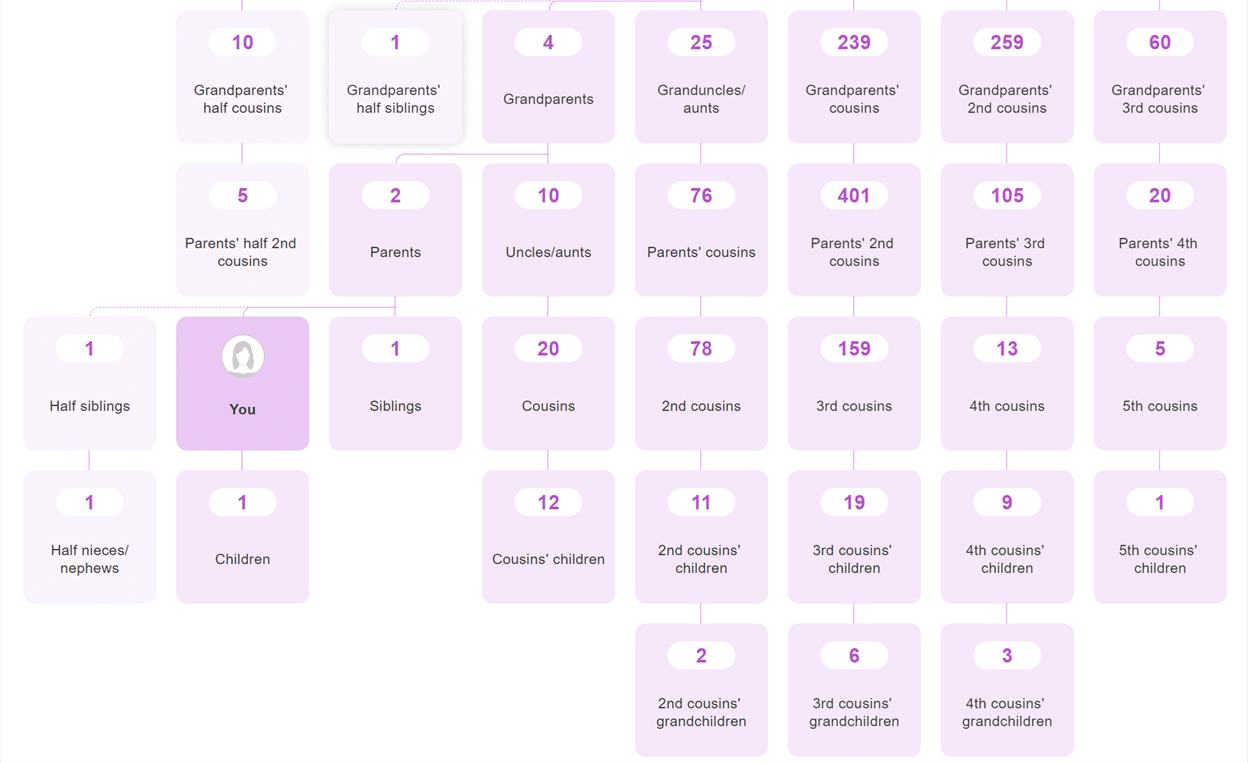
Your blood relatives is a massive ancestral chart showing the relationship you have with everyone with whom you share DNA as a relative by blood.
Whew! That’s a lot of detail about how we’re related to the dozens or hundreds or thousands of people in our family tree. How can we leverage this information to advance our genealogical knowledge or improve our tree?
Like the Family Statistics graphs in the Overview, the charts and graphs in the Relationship tab are “clickable.” For example, if I click on the purple block in the Your Blood Relatives chart pictured below that indicates I have 78 second cousins, MyHeritage will present a list of each of those 78 second cousins. Additionally, this chart helps us better understand our cousin relationships (which, by the way, Family History Daily recently explained in great detail).
My generation, yeah
Another fun relationship statistic to explore is contained in the “Generation difference” chart. Clicking “Same generation as you” produces a list of everyone in your tree who is, well, in the same generation as you (as the title promises). Sometimes as family historians we tend to limit our thoughts about folks in our generation as those who are close to us in age, but when it comes to our family tree, a generation can include individuals in a wide range of ages. The listing provided by MyHeritage Family Statistics shows you exactly who in your tree is included in your generation.
Another tool to improve your tree
The most helpful use of the Relationships charts might be found in the first graphic, titled General. The last metric in the chart measures the number of people in your tree who aren’t related to you by blood or marriage. This means that they’re floating somewhere in the ether of your family tree, but not ultimately connected to you. Clicking this section of the graph will take you to a list of these folks so you can determine how they are related and reconnect them, or delete them if they are truly unrelated.
Places, ages, and births, oh my!
The next three tabs — Places, Ages, and Births — are chock full of fascinating details about the folks in your MyHeritage family tree.
After Relationships, you’ll want to explore the Places tab in MyHeritage Family Statistics. Inside you’ll find three sections of data:
Places of birth,
Places of death, and
Places of residence.
Places are listed at the country level, not by state or county. As this information is based on the family tree you’ve built in MyHeritage, the listings and maps in the Places section will only display countries you’ve included in your tree.
The next Family Statistics tab, Ages, offers six helpful charts:
Age distribution (how many living people in your tree are in each 10-year age group)
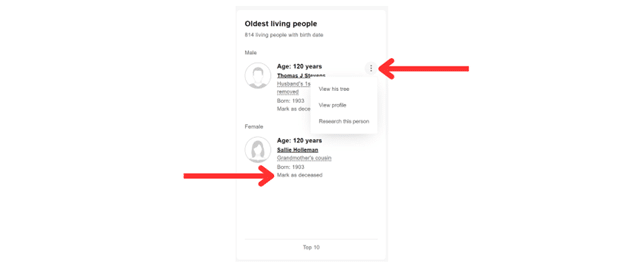
Oldest living people (oldest people with birth dates but no death dates)
Youngest living people (youngest people with birth dates but no death dates)
Average life expectancy (based on life span of people with both birth and death dates)
Lived the most (people with oldest life spans based on birth and death dates in your tree)
Lived the least (people with the shortest life spans based on birth and death dates in your tree)
While all of this information is fascinating for any family historian, the Ages charts and the included features can also be super useful in helping you shore up gaps in your tree’s data. For example, I am pretty sure the two individuals in my Oldest Living People chart did not both live to be 120 years old; in fact, the Family Statistics program has assigned this age because I don’t have death dates for these folks in my tree and have not marked them as deceased.
MyHeritage makes it easy to remedy this problem, right from the Oldest living People chart. I can either click the link in the words “Mark as deceased” or open the three-dot menu to dig deeper into the person’s place in the tree or their profile, or perform more research.
You may notice a unique feature in the last section of Ages, Lived the Least; there’s an “X” in the upper right corner that allows you to delete this particular section from the Ages page. You’ll find this option on various sections throughout the Family Statistics pages, but not on all sections.
Births is the next section in the Family Statistics suite, offering three graphics:
Birth months
Zodiac signs
When were people born (by decade or century)
These charts aren’t clickable, but they’re still quite interesting! I mean, how else would I have known that most of my ancestors were born in March and were Pisces?
Married (and divorced) … with children
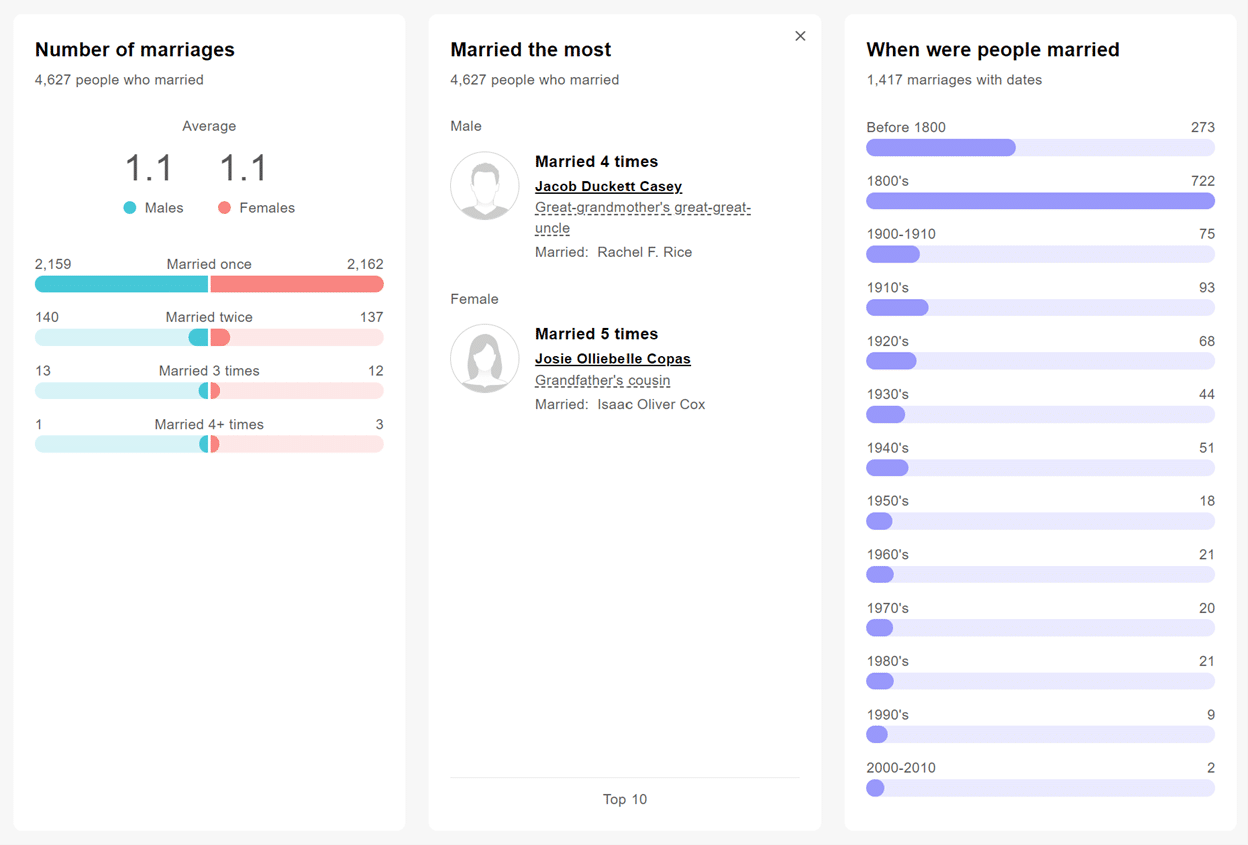
The Marriages tab, which follows Births, pulls a ton of fascinating data from your MyHeritage family tree — more than any other category. Charts include:
Number of marriages (per individual)
Married the most
When people were married (by decade or century)
Age at marriage
Oldest when married
Youngest when married
Marriage duration in years
Longest marriage
Shortest marriage
Average age difference (in bride and groom)
Husband much older
Wife much older
Like all of the data in MyHeritage Family Statistics, the data presented in the graphics is only as reliable as what you’ve entered into your tree. Therefore, when I see in my Longest Marriage chart that an ancestor was married for 270 years, I can easily see that this person’s details are entered incorrectly in my tree — either I haven’t listed death dates or haven’t marked this person as deceased.
Another common family tree problem highlighted by the information in the Marriages tab is found in the Youngest When Married chart. It’s highly unlikely that my male ancestor was married at 11 years old, and a female ancestor was married at 10 years old — especially since the section shows me her groom was 37 years old at the time. Again, Family Statistics is providing valuable information (and an incentive) to help me strengthen the validity of my tree!
Sweet children of mine (and my ancestors)
The Children tab is also quite robust, with charts including:
Number of children per family
Family with the most children
People with most children
Age when having children
Youngest when had a child
Age difference between oldest and youngest children
Largest age difference between oldest and youngest children
Smallest age difference between oldest and youngest children
Like the previous sections, the Children page helps to highlight some of the most glaring issues in your family tree. Siblings born 222 years apart? A mother who gave birth at age 12 months? A father who had a child at age 264? Sigh. (Imagine me hanging my head in shame!) Luckily, these issues are easily resolved by clicking the ancestor’s name and making much-needed corrections.
I personally appreciate both the Marriage and Children sections for displaying details that really normalize the stories in my family tree. So often we family historians believe the long-held myths that our ancestors married as pre-teens, had 20 children, and died young. Of course, there are situations where these adages are true, but they’re the exception, not the norm.
In my tree, for example, the average age at marriage was 26.9 for males and 22 for females; the average number of children per family was 2.2; and the average life expectancy was 63 and 64 for males and females, respectively. These statistics are not much different than today’s demographics.
Last, but not least
Divorces, the last page in Family Statistics, showcases data you might not always think about when researching your family history, but can prove extremely helpful. There’s a lot of information to be found in divorce records — check out this great Family History Daily article by Janet Meydam about exploring divorce records to learn more!
According to MyHeritage Family Statistics, my personal family tree only includes 38 people who divorced; I find this hard to believe. Although the records can be challenging to locate, divorces have been recorded in the United States in various forms since the early 1700s.
The Divorces tab contains six charts:
Number of divorces
Divorced the most
Longest marriage ending in divorce
Age when divorced
Oldest when divorced
Youngest when divorced
Like most of the other sections throughout the Family Statistics tabs, most of the Divorces charts are clickable and can be expanded to show the Top 3 or Top 10 in the category.
Next steps with Family Statistics
As we’ve explored each tab and chart included in MyHeritage Family Statistics, we’ve detailed several ways you can use the charts pulled from your tree to update the information in your tree by flagging missing dates, highlighting deceased individuals who aren’t marked as deceased, and recognizing anomalies in ages.
One of the best aspects of Family Statistics is that it updates every time you open it. As you correct errors and add missing detail, you should begin to see a much more accurate picture of your family based on your MyHeritage family tree. Plus, the more people and information you add to your family tree, the more interesting your statistics will become. You’ll have more than enough random stats to share with your relatives at the next family reunion. Good luck, and have fun!
Thank you to Patricia Hartley for creating this guide. Patricia has been researching family history for over 30 years and has an M.A. in Public Relations/Mass Communications from Kent State University.
For nearly 30 years Patricia Hartley has researched and written about the ancestry and/or descendancy of her personal family lines, those of her extended family and friends, and of historical figures in her community. She has a B.S. in Professional Writing and English and an M.A. in English from the University of North Alabama in Florence, Alabama, as well as an M.A. in Public Relations/Mass Communications from Kent State University. She’s a member of the Alabama Genealogical Society, Association of Professional Genealogists, National Genealogical Society, International Society of Family History Writers, Tennessee Valley Genealogical Society, Natchez Trace Genealogical Society and the International Institute for Reminiscence and Life Review.
Leave a Comment
We use cookies to bring you the best experience, record visits, serve ads, provide signup forms and deliver other essential functions.
This website uses cookies to improve your experience while you navigate through the website. Out of these, the cookies that are categorized as necessary are stored on your browser as they are essential for the working of basic functionalities of the website. We also use third-party cookies that help us analyze and understand how you use this website. These cookies will be stored in your browser only with your consent. You also have the option to opt-out of these cookies. But opting out of some of these cookies may affect your browsing experience.
Necessary cookies are absolutely essential for the website to function properly. This category only includes cookies that ensures basic functionalities and security features of the website. These cookies do not store any personal information.
Any cookies that may not be necessary for the website to function and are used specifically to collect user personal data via analytics, ads and other embedded contents.