Millions of people have received DNA tests over the holiday season and, as results start to finally roll in, many of you will be looking at ethnicity reports for the first time – 39% of this, 22% of that, 2% of something totally surprising…it can all be very exciting.
But what does it all mean? Can you really take these percentages at face value? The answer is a resounding no. While your results certainly contain truths, accepting your ancestry report without additional interpretation will often lead you to confusion and inaccurate assumptions about your family’s history.
Despite feeling downright lost when seeing results for the first time, many people never question them. They simply assume that DNA is always accurate (how could it not be?), or may be unsure how to dive deeper to solve inconsistencies. Others will disregard a confusing report altogether – assuming a mistake has been made.
But, luckily, there are tips and tools that can help you understand your results in the proper context and form a more accurate view of your genetic past. This article explores some of them.
Are My DNA Results Accurate? Why Your Ancestry Report is So Different Than You Expected
Please know that we have partnered with some of the companies mentioned in this article and may earn money to support our work if you choose to buy tests or other services linked to from our site.
Many of you who have received an ethnicity percentage breakdown (admixture) from companies such as AncestryDNA, Family Tree DNA or MyHeritage DNA, will be surprised to discover that your makeup is not at all what you imagined. Perhaps you are missing regions you expected to find (such as Irish or Italian), or have others you did not expect all (like a large amount of British Isles or some Jewish).
If you have tested with (or uploaded your raw DNA to) multiple companies you may be even more confused since your results will likely be quite different from test to test. You might find yourself asking, Which one of these DNA tests is the most accurate? Which results should I trust? Am I really 36% Scandinavian?
Confusing results may completely change your view of your ancestral past or cause you to question your roots or family history research. And because ethnicity percentages can seem so absolute, you might be tempted to believe them just exactly as they are. Or, if they collide with your existing family history, you might be tempted to reject them. Both of these reactions are actually quite common.
But before giving in to these scenarios, let’s consider some important points and view your results in a more reasonable light.
A disclaimer – DNA results can cause some serious surprises, so while educating yourself about how these tests work can help you make sense of confusing results and discrepancies, some unexpected information may actually be related to unknown facts about your family’s past.
A non-paternal event (a father not being a biological father), a hidden adoption, and complete inaccuracies in family stories (thinking your family is from a region, or related to a group, you are not) crop up all of the time. Sometimes these things can be quite obvious once test results come back in, sometimes they are hidden, but they will certainly cause you to do some reexamining.
But you shouldn’t automatically assume that surprises in your results are due to shocking events, confusions about your past, or inaccuracies. They are very often due only to how you are reading your report.
The key to making sense of it all is to understand how your ethnicity estimate is decided upon in the first place. Knowing how these tests work will better allow you to determine which bits of information call for closer examination and which bits already fit with what you know about your family’s past.
Let’s start by understanding why it is that your results are not a perfect reflection of your ancestry. It’s DNA after all, shouldn’t it be foolproof?
The issue with “inaccuracy” in DNA ethnicity reports doesn’t have anything to do with your actual DNA. Rather, it has to do with how your DNA is interpreted and presented by the companies providing your results. Each of these companies uses software to compare your information to that of available sample populations in their databases – and it is in the way that these available sample populations are structured, their availability (or lack thereof), how they relate to each other and how the company chooses to present this information to you that causes confusion. This can be demonstrated by looking at several tests from different companies for the same individual.
Below is an example of the discrepancies that can be seen from test to test for the same exact person. Note the differences in population names and percentages.
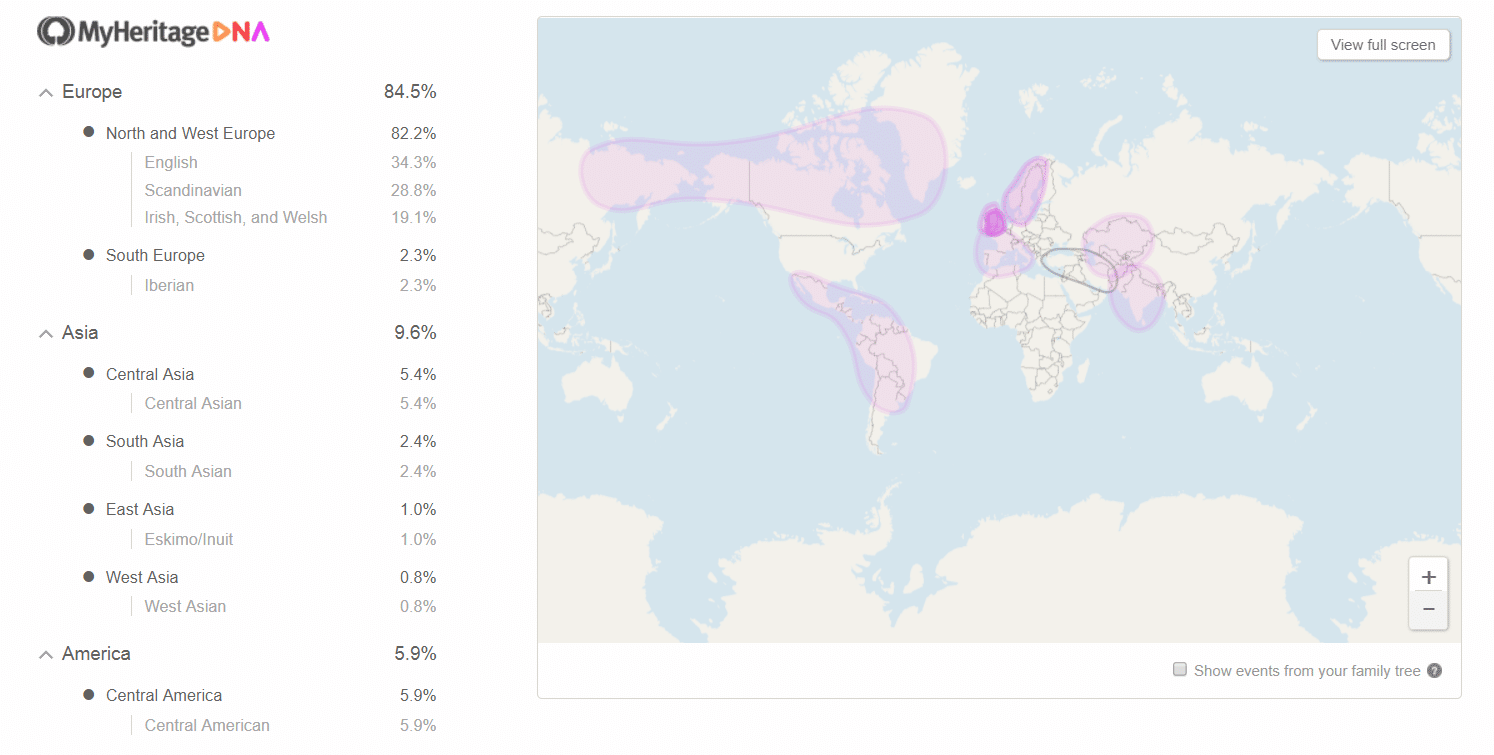
MyHeritage DNA Ethnicity Estimate
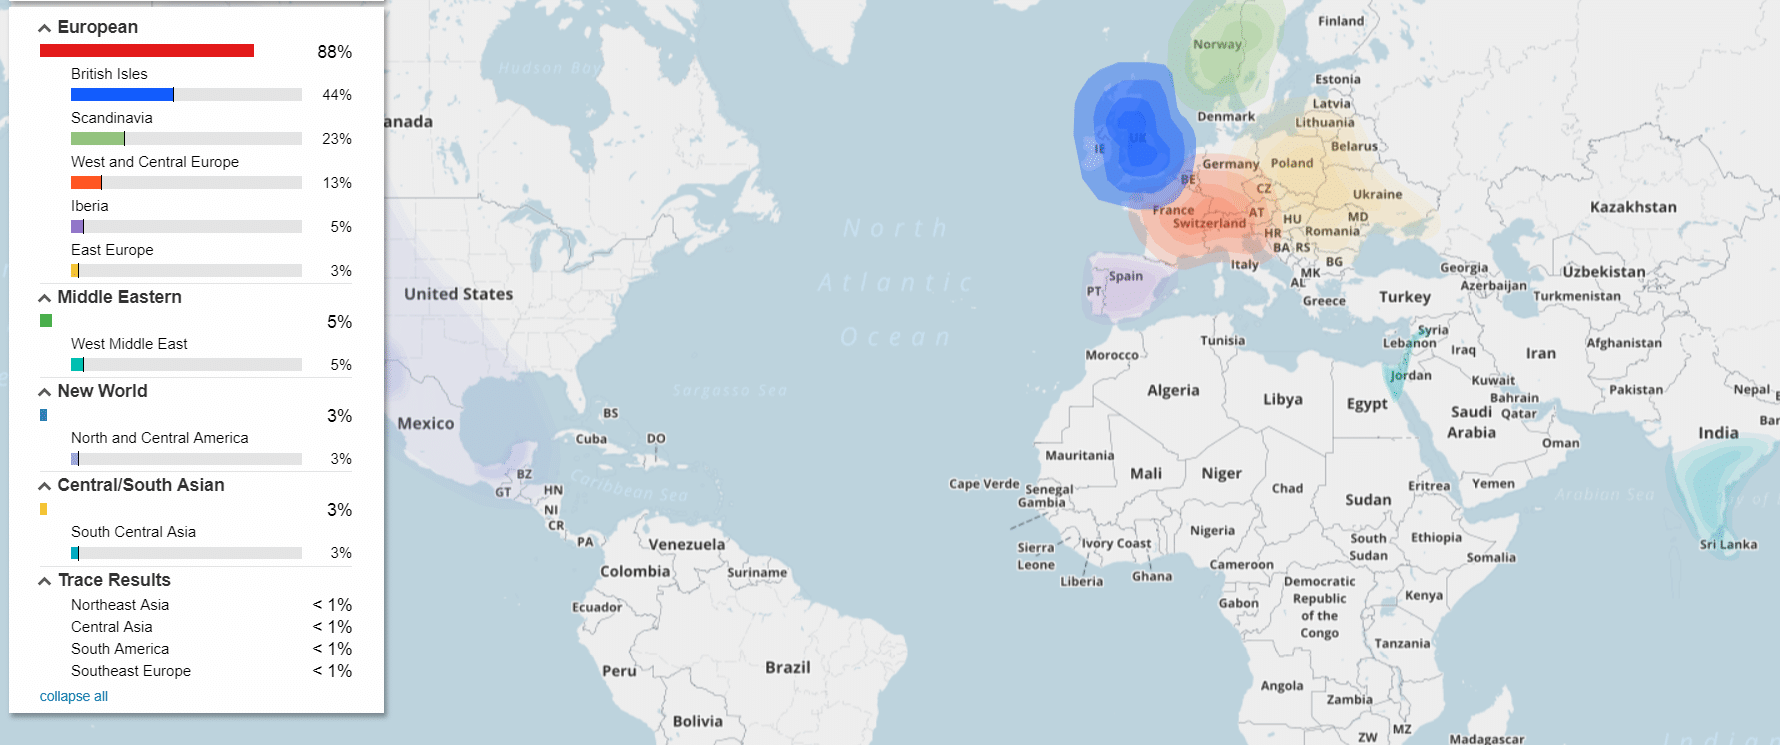
Family Tree (FTDNA) DNA Ethnicity Makeup (MyOrigins)
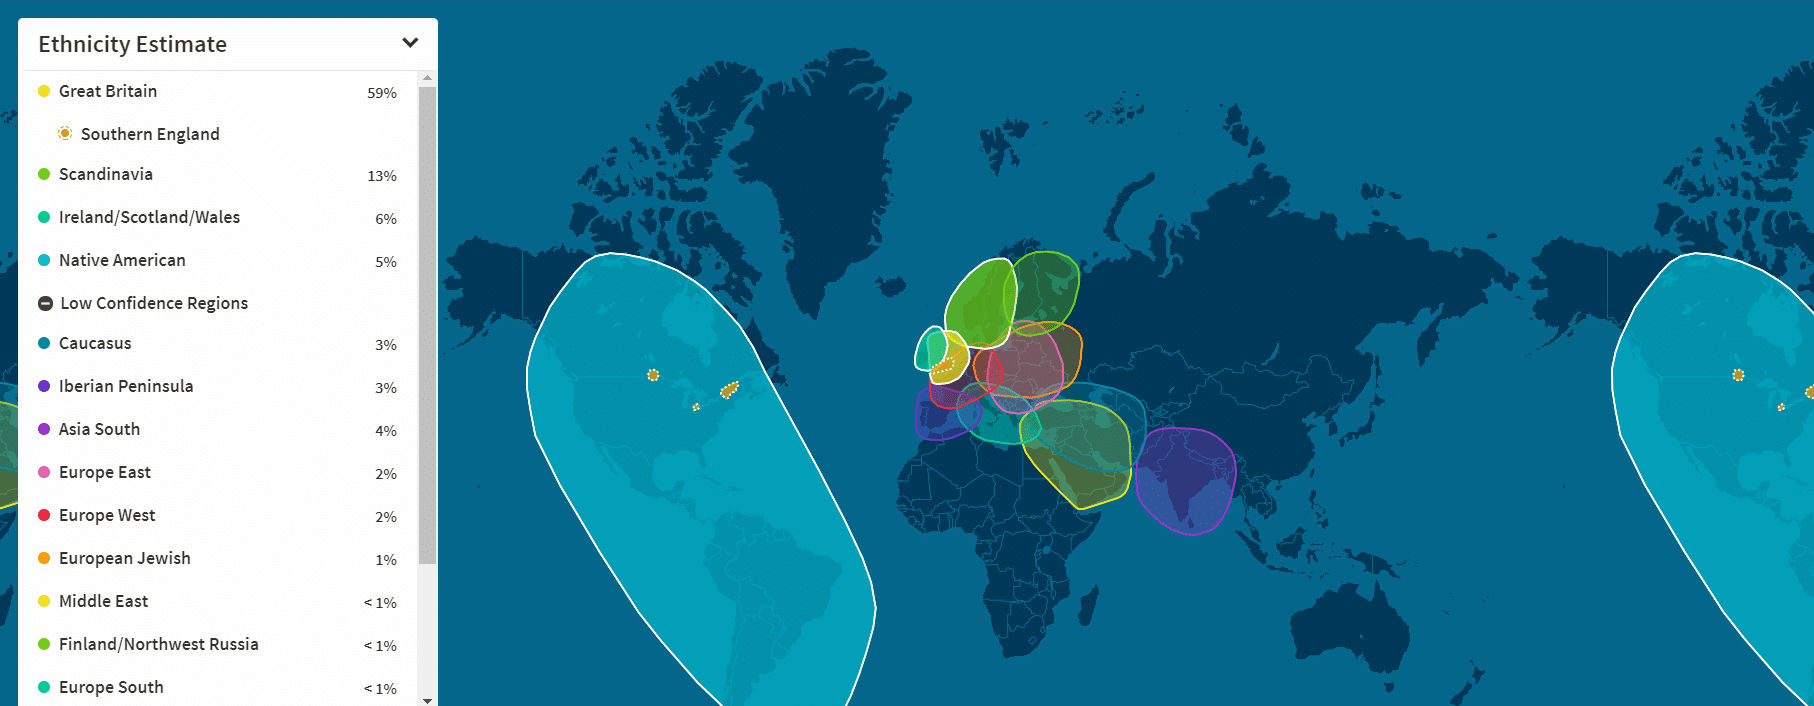
AncestryDNA Ethnicity Estimate
There are some big differences here. The DNA for this person certainly hasn’t changed from test to test – so what has? Which of these results are the one to trust?
The answer is…none of them, and all of them.
The truth is that all major testing companies are doing their best to give you the most accurate results. Although they all have weaknesses it is in their best interest to provide their users with results that correctly reflect their ancestry. Every testing company wants to be the most accurate choice. That’s just good business.
But these companies also want to provide you with simple and straightforward results that you can easily read, make sense of and share. For this reason, a good deal of effort has gone into creating attractive layouts, understandable population groups, and maps that show you, at a glance, where your ancestors are supposed to have been from.
In placing the emphasis on this simplicity, the complex process of presenting your genetic data must be limited, and more detailed information that may help you better understand your results is often excluded – such as detailed definitions of population groups, explanations of population overlap or the science that determines how percentages are calculated.
Thus, you’ll have to take some time to educate yourself.
Here Are Some Important Things to Known When Interpreting Your Ethnicity Report
Populations are not always what they seem. When you receive your results and start looking at percentages it is easy to see a population and make assumptions about what that population is. But to actually understand what it means in the context of the test you have taken will need to educate yourself about that population.
The best way to do this is to carefully read the descriptions provided by the testing company to fully understand geographic boundaries, included and excluded regions and Peoples, and known historical events that influence that population’s makeup. Some tests do a better job than others with providing this information, but all of them provide some level of access to this data.
To demonstrate how confusing populations can be, and how misleading their names are, we can look again at the three reports shown above. The person that these tests reflect has a known ancestry from the Netherlands (and the closely related regions of Germany, Belgium, etc) of approximately 25%. This means that, genealogically, the ancestry from that region is 25% because one grandparent and their ancestors are from that area. However, since we do not inherit exact percentages from each grandparent the actual amount may be slightly more or less genetically.
Given this information we would expect to see around 25% from this region in our ethnicity makeup. However, if you will notice in the images above, we don’t see anything close to these numbers from any test that was taken.
Why?
The first thing we see is that the Netherlands and surrounding areas do not have their own population. They are included under different names depending on the test. So we should not expect to see “Netherlands” or “Germany” at all. In fact, many sample populations we might be looking for are simply not present because they are not genetically unique enough (given our current analysis tools and sample sizes) to allow for separate “populations.”
Family Tree DNA instead shows the Netherlands and Germany in the region labeled as West and Central Europe, as a subcategory to European, and gives a percentage of 13%. This is lower than anticipated but we can also see that Scandinavian and British Isles are included. Given that these two populations are showing in much larger amounts than we would anticipate, we can assume that some of our West/Central European is actually showing as Scandinavian and/or British Isles. A closer look at the map shows that the British Isles population overlaps quite a bit with our region of interest (the Netherlands).
While this is not ideal, we must remember that many populations overlap in their genetic similarities. The genetic populations that are used to determine your percentages may be very closely related and difficult to distinguish from one another.
And this is further influenced by your own unique makeup. A person with Western European, Scandinavian and British Isles ancestry may find that one percentage takes over the others and shows in a much greater percentage than appropriate – or that the combined total for all regions is distributed differently than we would expect.
Often, by reading the explanations for the population clusters used, we are given clues to help us understand why this happens. Here is an excerpt from FTDNA’s explanation of the British Isles.
Starting in the late 8th century CE, the British Isles were invaded and settled by Viking parties during the Viking expansion. Normandy later invaded and solidified cultural and economic connections between the British Isles and continental Europe. To this day, these ancient occupations and trading practices left a lasting impression on the genetic relatedness between populations in the British Isles cluster and Southeast Europe, Scandinavia, and West and Central Europe clusters.
You’ll find all kinds of important information in population descriptions that may completely change your view of the percentage in your estimate. But many people skip reading them, or don’t take the time to consider the implications of what they are reading.
A great example of this is in AncestryDNA’s Great Britain population. Just a glance at the map shows us that the boundaries extend far beyond Great Britain itself. Further research reinforces that this population’s title is a bit misleading and that many with heritage from the Netherlands or Germany find themselves lumped into this seemingly unrelated category. 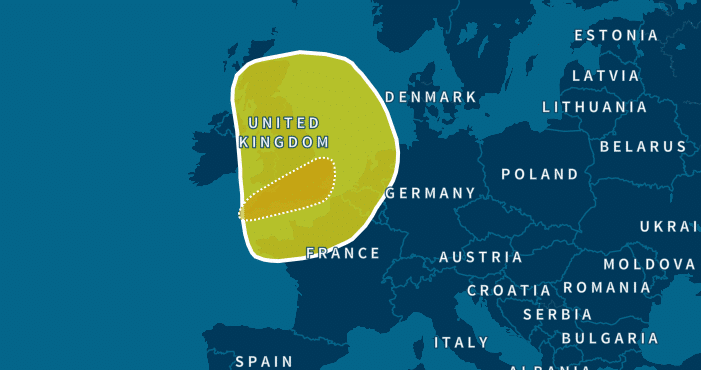
This same scenario can be applied to many populations that you see in your reports, so look for clues that will help you determine if a percentage that is larger (or smaller) than you expected can be explained through a closely related population.
You can find these descriptions by clicking on your percentage in any of the major tests or by looking for help files that explain them in each help center. We have linked to these important resources at the bottom of the article.
We have now looked at how smaller or larger unexpected percentages can be explained, but what happens when we are missing a result altogether, or it shows as a tiny “low confidence” amount?
You may have noticed that AncestryDNA shows only 2% of Europe West in the screenshots above and MyHeritage seems to show no ancestry at all from the region that encompasses the Netherlands. These results could certainly lead to some raised eyebrows, especially if we had taken only one test and had no additional data. It may even cause us to question our family’s past – at least temporarily.
In terms of Ancestry, we can explain this unexpectedly low amount by referring to the Great Britain map outline that we already examined. Our ancestral region actually fits pretty well into that outline.
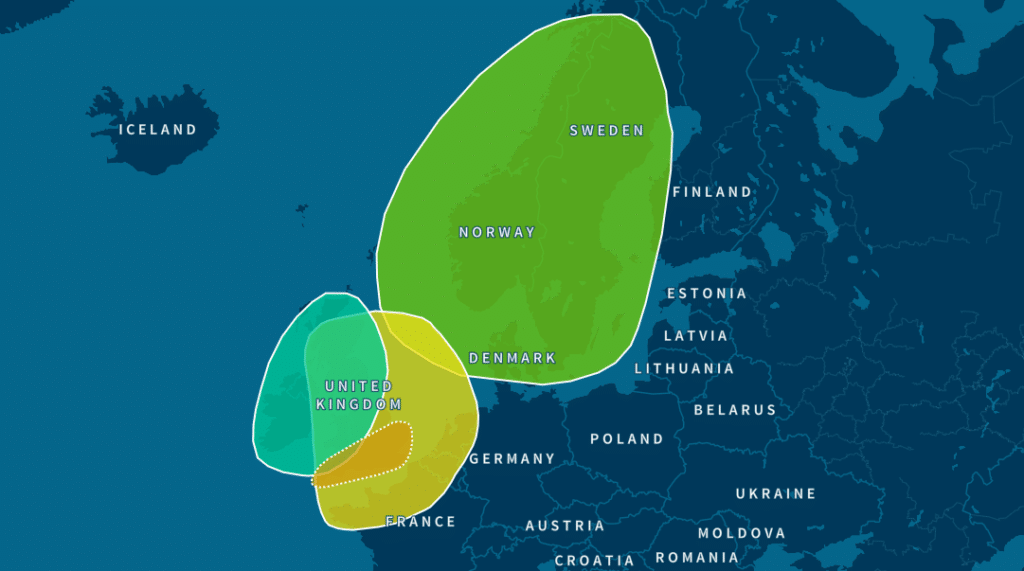
But we’re going to have to do a little digging to understand why this is happening on MyHeritage since none of the given populations match our ancestry in the Netherlands. You can see that it is excluded in the map below.
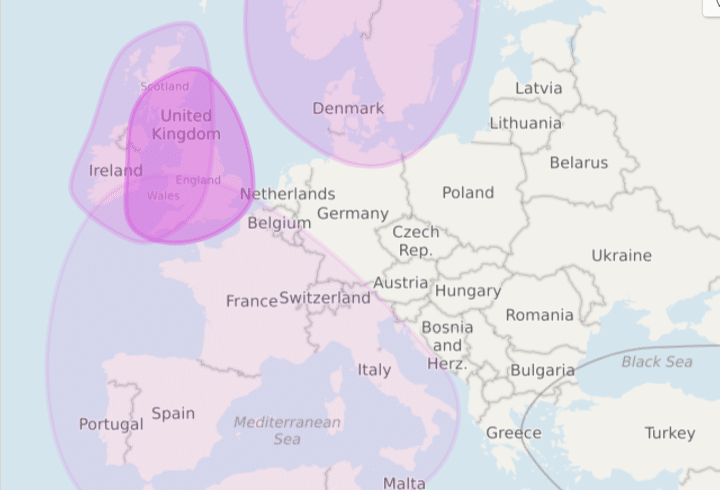
MyHeritage does show 82.2% North and West Europe, and while this seems like a good fit initially, we can see that this percentage is broken down into 34.3% English, 28.8% Scandinavian and 19.1% Irish, Scottish, and Welsh. None of these populations match our known ancestry from the Netherlands/Germany.
The first thing we want to do is read the population descriptions for the percentages we are showing and look at the regions they cover on that map. Doing so reinforces that these populations are deeply interconnected and shows us that the Scandinavian and Iberian populations, especially, come very close to covering our known ancestral region.
Next, we want to find out if MyHeritage does, in fact, have a population that covers the Netherlands, Germany and surrounding regions. To do this we must view all regions, not just those we match. Each of the major companies makes it fairly easy to find these populations. Look for FTDNA and Ancestry’s as a link at the bottom of your ethnicity estimate. It appears as a separate tab next to your results on MyHeritage.
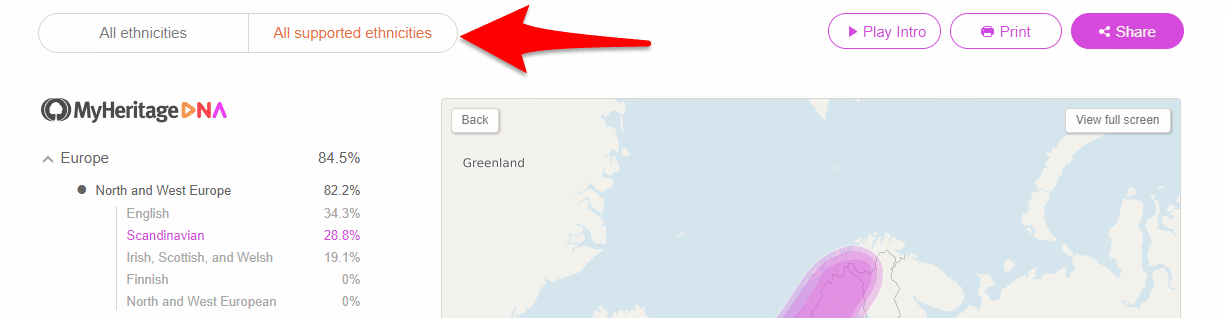
And, in fact, you can see that they do have a population covering the Netherlands – North and West European. MyHeritage states: “The population of Northern and Western Europe mainly includes German, French, and Dutch people.”
Yet this percentage is not included in the results. To understand why, we must consider the interconnections of all populations in this region and remember that our unique genetic makeup can have a big impact on results.
People with a mixed heritage may commonly find that their results show populations they don’t actually match (since the analysis software may confuse certain mixes as a separate population) and may find that expected populations are missing because they have been drawn into other related populations that they also match.
In this case it appears that the expected North and West European is being drawn into Scandinavia (and a bit elsewhere). We especially suspect Scandinavian since the percentage for that region is considerably higher than our known or suspected ancestry from that area. We can only assume that our Dutch ancestry is so similar to that from parts of Scandinavia that, when viewed with our actual Scandinavian ancestry, it was confused together and combined.
To see how this works, let’s take a look at the testers’ mother – who has a genealogical ancestry of 50% from the Netherlands and related regions and no known Scandinavian ancestry. You can see in the image below that she shows 48.6% North and Western European – spot on.
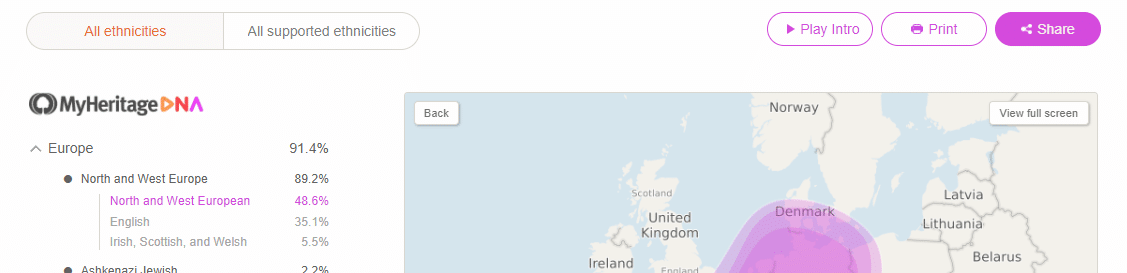
The lack of Scandinavian ancestry, and a greater amount of markers from Western and Northern Europe, allows the percentage to come out more cleanly. The DNA shows in the expected category, whereas in her daughter the percentage from the Netherlands shows as other populations she is mixed with.
When a person’s heritage reflects a mixture of closely related sample populations the testing company must infer how to best present data. Sometimes they don’t get it right – but using your own knowledge allows you to make some sense of what may initially look like a mistake. We need to be flexible in our interpretation of results by considering the definitions of populations and by understanding how populations relate to each other, all within the context of our own DNA.
Of course, we don’t want to try and interpret our results to match a fanciful understanding of our past. Results should be interpreted in the light of a well-researched family tree – with an understanding that our research may also have errors or unexpected events. DNA and traditional research should work together.
What about the difference in siblings’ results? Shouldn’t siblings be identical or nearly identical? Or parent/child results – why are there so many inconsistencies?
Siblings show us that even tiny differences in the amount of DNA you inherited from a particular region or group can have a dramatic effect on results. While you inherit 50% of DNA from each parent, the amount inherited from each grandparent can vary – it is not an exact 25%. Therefore siblings inherit a certain amount of unique genes from their parents (representing different amounts of genetic data from different grandparents) and their ancestry makeup reports can be quite varied.
Instead of looking at this as inconsistencies to be ignored, consider it as additional clues to your genetic heritage. Seeing different populations between siblings is your chance to see different DNA held by your ancestors. If the inconsistencies seem too great, take the time to try to figure out why. You will be a savvier researcher for it.
The same applies to child/parent relationships. How can, for instance, a child show a percentage of something when neither parent reflects it? Consider not just the population in question to find your answer, but the combination of all populations for that person and their parents. Could two other populations from the parents be combining in the child as another population? As explained above, a mixture of closely related genetic populations can easily cause confusion in results.
The ease at which populations become confused should be considered especially as it concerns small percentages in our reports. Values of less than 2% (and higher in some populations – such as Jewish) are very unreliable and should be taken cautiously. While a surprise amount of Jewish, Native American, Irish or Central African can be exciting, and can sometimes reflect ancestry from that region or group, it may also simply be a confusion of the data based on other elements in your makeup.
There is a decent amount of information online concerning different populations and related trace percentages. It is to your benefit to take the time to understand why you might be seeing a trace amount of an unexpected population before trying to trace it genealogically. Educating yourself about the genetic history of your regions of interest is a great first step and the information you need can often be found with a google search.
It is also important to remember that some trace amounts that prove to be worth investigating may end up being much further removed than a percentage initially suggests, so be prepared for some digging and use your cousin matches to help guide you (more about that below).
And just as misleading trace data can be presented in your report, other data can just as easily be excluded. DNA from ancestors many generations back will often not show in your results due to the small amount of DNA (or lack of DNA) you inherited from these individuals – but this doesn’t mean that those ancestors didn’t exist.
If, for instance, you have a family story that says you have a Native American ancestor don’t give up trying to find that ancestor just because your DNA does not show Native American. Yes, many of these family stories are incorrect, but some of them are not. Traditional genealogical research and advanced genetic genealogy can reveal distant ancestors even when an ethnicity estimate does not show a percentage.
Special Reminder: Remember that even if you discover Native American ancestry via a DNA test, that test will never be able to tell you what tribe, band or nation it relates to and can not be used to apply for tribal enrollment. Registered members of federally recognized tribes have very recent, documented ancestry and trying to use DNA results to apply for tribal enrollment is inappropriate.
Examining modern DNA and trying to make sense of it in the light of thousands of years of human settlement, migrations, and genetic mixing is no simple matter. Many factors need to be considered and clues analyzed to be able to make sense of it all and give you some idea of where your ancestors came from. No computer program is perfect and so we must look at results objectively and try to sort them out in the context of all of the information that we have.
Don’t fall into the common trap of taking these results at face value or disregarding them simply because they seem incorrect at first glance.
Here’s How to Make Sure You are Making the Most of Your Own Ethnicity Estimates
1. Educate Yourself – Read all of the population descriptions that relate to your genetic and genealogical heritage (as well as those that you are missing) to help make sense of your results. Visit the online help centers for the tests you have taken and read the documents, articles and guides. Also, read “white papers” to better understand the science behind these tests. The information in these white papers can be overwhelming at first glance, but if you can wade through the material you will be able to view your results in a new light.
- FTDNA’s Help Center, Descriptions of Population Clusters | Methodology White Paper
- Ancestry DNA Help Center, White Papers, Detailed Population Information
- MyHeritage DNA Help Center
- GEDmatch Wiki (many population descriptions also exist on external sites from the test creator)
- DNA.Land Help Pages
Furthermore, human movement and genetic mixing over time is an incredibly complex matter. Spending some time educating yourself about human history and genetic makeup in the regions you descend from will be a great deal of help in puzzling out unexpected percentages.
2. Test Through Multiple Companies – After you have tested with one company you should consider testing with others. This will help you identify patterns in your DNA results and give you a better chance of getting an accurate picture of your family’s past. It will also allow you to take advantage of the additional analysis tools each company offers.
Ancestry and MyHeritage both have advanced platforms for combining your DNA results with your genealogy research and Family Tree DNA and GEDmatch have advanced tools for analyzing your data. Read about MyHeritage’s genealogy friendly platform here. We have a detailed guide to all major tests here.
Luckily, you can do this fairly inexpensively, or for free, in many cases.
MyHeritage, DNA.Land and GEDmatch are all well-respected places that you can upload your raw DNA data to to get ethnicity estimates without any additional cost. You can get more details on this in our article on DNA discounts.
FTDNA also allows uploads for free (for cousin matching and some tools) and provides their MyOrigins ethnicity reports for a small additional fee.
Ancestry does not allow uploads in any form, but they have been offering DNA kit deals more often so keep an eye on their site.
3. Test More People in Your Family – While this can get expensive fairly quickly, you should try and test as many people in your family as you can afford to. This includes parents and grandparents, aunts and uncles, siblings etc. Choose your favorite testing company so that everyone is in one place and then upload those results (with permission) to other test sites. Testing relatives will give you a much greater understanding of your heritage, and testing relatives from different family lines will help you make sense of your ethnicity reports and cousin matches genealogically.
4. Use Cousin Matching, Not Just Ethnicity Reports – This is one of the most important things you can do when trying to understand your genetic past. Cousin matches, especially more recent ones, are incredibly useful when trying to solve mysteries, understand your own percentages and determine what percentages match which parts of your tree. Explaining how to do that would be another article in and of itself, so spend some time researching online, reading help documents and forums to understand how this works. We also cover this in our online genealogy course.
5. Combine Your Genetic Research with Your Genealogy Research – Trying to understand your genetic past without the context of a well-developed family tree is extremely difficult. Of course, for some, it is necessary. If you were adopted or find that one of your parents is not in fact your biological parent you may be left in the dark – at least for a time.
But if it is at all possible, take the time to build a family tree so that you truly understand your results. Having only a vague understanding of your ancestry, mixed with DNA results, can be a recipe for ongoing confusion and misinterpretation.
If you’re not familiar with family history research we encourage you to take the time to read the articles on this site and the many other quality sites online. Starting your journey can be as simple as choosing to sign up for a site like MyHeritage or Ancestry (paid), downloading a program and using free genealogy sites, or getting involved in a free online community tree like WikiTree or FamilySearch. A new site, RootsFinder, allows you to build a free family tree and pulls in hints from many sources. Read more about finding a tree program here.
And that leads us to our final point. While it would be convenient for us to be able to look at DNA results on their own and see an ultimate truth – this is simply not possible. DNA results are presented to you without any knowledge of your actual family history based on some very complex science – and this data is limited by available scientific understanding and technology.
It is our job to take it one step further, as researchers, if we really want to make sense of our results. We need to use all of the information we can gather and view our results within the context of our matches and family history research to truly understand them.
And while this article only covers some of what we need to know to better interpret results, the above examples of how DNA can be displayed in multiple ways shows us that we must always flexibly analyze our results. Over time, as we discover more information and our research becomes more detailed, we can reframe the data we have received and better use it to reinforce, reject or redirect our genealogical research for a stronger family tree.
For further (and more detailed) reading on DNA research we suggest the following expert sites and resources in addition to the ones mentioned in the article:
International Society of Genetic Genealogy
You Might Also Like:
Which DNA Test is Best? A Detailed Guide to Help You Decide
How to Save Money on DNA Tests
MyHeritage’s Free DNA Upload Can Help You Grow Your Tree: Here’s How
By Melanie Mayo, Family History Daily Editor
Hi there,as a New Zealand citizen growing up i thought i was roughly half English with a bit of Portuguese in me so i decided to take an Ancestry D.N.A test which left me disappointed to find out that not only i ended up being 55% Scottish but there was no Portuguese in me.Interesting at the same time though.
It is very confusing & frustrating. We have talked to many relatives and we are able to trace back family members to Portugal and Italy. (very Italian & Portuguese names too). However when my husband’s Ancestry DNA results came back, there is no Italian or Portuguese. We family bibles, birth certificates, boat manifests etc. Needless to say this seems to be a waste of money. We are continuing to research manually. Also, keep checking the website and see if anything changes.
I’m so sad. Our family will never be the same and I doubt I’ll
See my grandchildren again. My daughter is convinced there are half siblings due to a DNA report from a home kit. I know there are no half siblings. Not a fan of genetic testing.
I know there are
What this very lengthy article doesn’t explain is the major reason siblings and parents can have totally unexpected results from what you consider yourself to be based on your genealogy research and your ancestors origins. That is what is called “Random Assortment of Genes.” Let’s say that you put two bags of 64 differently colored marbles. In your mind imagine several differences in the two . Now what happens in genetics, is you will inherit half of your father and half of your mothers’ genes, both ethnically and what all else goes into your makeup. If you blindly draw out 32 from each bag, you will seldom get anything near identical in each succeeding draw. This is why what we expect and what we get are different.
If your results are on any DNA testing site, be sure to revisit them often, as technology and data is ever increasing and your results will change, sometimes dramatically.
I knew most of my heritage. English,Walsh,Irish, native American. I talked. to older members of my family and have some picturesand named. Some of the phrases they used, I am still working on..I have some time left. I am only 86.
interesting what I want to know if their is any native American in me.
Unfortunately, it appears you’re a little confused. Y- DNA tests are for the paternal i.e. father side of your genetic pool. whilst Mt-DNA tests are on the mitochondrial area of the cells. These later ones relate to your maternal i.e. mother’s side of your genetic pool. Given the low levels of mutation rates within both, and the lack of mixing of these areas of the genes, they can tell you the genetic background/origin of both your father and your mother respectively, which may be the same, similar of different, – there is no rule for this. The real mixing of genes, which occurs in the majority of the areas of the genome is reflected in an autosomal dna test.
Hence there are 3 tests which can each indicate different levels/degrees of backgrounds – it’s all a case of knowing what you’re looking at.
Usually it will send you an email to confirm. If this didn’t happen, try to refill out the form. If the page looks like it’s cut off it might be because it’s in “mobile” view for cellphones. I don’t know which browser you have but you can Google search the name of the web browser and the words: change to desktop view.
Good luck!
i have two y-dna tests that came back m269, pretty much what i expected, my paternal branch is anglo norman from over a thousand years ago, but as part of a package that included the cheapest mt-dna offer i’ve ever seen, i sent a sample to national geographic. geno2, it came back l-371, which does not even seem to be a mutation of m269. supposedly a mutation from about a thousand years ago in wales while my people were in devon, gloucestershire, and cornwall, which is geographically close, and if l-371 were a mutation of m-269 it might be believable. now, as as it stands i can’t trust the mt-dna result because the y-dna doesn’t seem to be my sample., so it was a total waste of time and money. believe your family story before you believe these dna places, if they can’t agree with each other, than at least some of them are wrong.
I am 95 years old…was interested in free daily tips….read you would like me to confirm my email etdpc….but I don’t see where I can confirm…I am totally confused…